Canada exceeds expectations

What makes Canada a leading mining nation?

Canada‘s mining industry has 430 000 direct employees and accounts for 6.0 % of the country’s economic output. In terms of exploration expenditure, the country has ranked in one of the top places for years. This article provides current figures and impressions concerning the key resources and companies, and explains why Canada counts as a leading mining nation.

1 Canada’s economic development

Canada has an important geostrategic role in the G7, yet does not always subordinate itself to the goals of other nations. One example is defence spending, which totalled 36.7 bill. US$ in 2023, a handsome sum, but only 1.29 % of the country’s economic output and accordingly well below the 2 % specified by the USA and the spending of other NATO partners. In economic terms, Canada is faring better than most other western nations. The recession forecast by economic experts has been avoided. Inflation has fallen from a peak of 8.1 % in June 2022 to 2.9 % in January and 2.8 % in February 2024. Inflation is likely to fall further and reach the 2.0 % target at the beginning of 2025. The employment market is stable. Today, over 1.1 mill. more Canadians are in employment than before the pandemic, evidencing the fastest recovery of the labour market among the G7 countries.


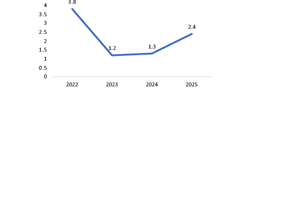
The real GDP is picking up this year, boosted by recently introduced reforms in monetary policy and the easing of fiscal policy. Real wages (wages adjusted for inflation) have increased, that means that Canadians have more purchasing power. In its latest forecast, the IMF (International Monetary Fund) is expecting that the GDP and will increase slightly in 2024 and the next few years from 1.2 % in 2023 to 1.3 % this year and 2.4 % next year (Fig. 1). Accordingly, Canada is doing much better than, for example, the European Union (1.1 % in 2024) or the countries in the Euro zone (0.8 % in 2024). In the second quarter, the GDP grew by around 2.1 % compared to the previous year. For the coming year, all signs are pointing to recovery of the economy and further growth.


2 Overview of Canada’s Mining Sector

In 2023, over 250 mines were operated in Canada. More than 60 metals and minerals were extracted. Canada’s mining sector counted 430 000 direct and 281 000 indirect employees in a population totalling 40.9 mill. According to figures released by the Mining Association of Canada, in 2022, the mining industry with 161 bill. C$ (Canadian dollars) made up around 7.8 % of the value creation of the country’s industries amounting to 2 065 bill. C$ or 6 % of the GDP [1]. Fig. 2 shows the sector’s contribution to the GDP in 2022. A high share of almost 28 % (45.0 bill. C$) was reached by extraction (raw materials extraction), followed by mineral processing with 19 % (30.4 bill. C$) and metal smelting with 14.3 % (23 bill. C$). Canada‘s mining exports increased in 2022 to 153 bill. C$, which corresponds to about 21 % of the exports. 57 % of these exports went to the USA in 2022.


Of the mining costs in 2022, 23.3 bill. C$ were spent on the extraction of metal ore, 11.1 bill. C$ on the extraction of coal and oil sand and 10.7 bill. C$ on non-metallic ores like potassium carbonate (potash), diamonds and similar. Canada is in the leading position worldwide for potash, it holds the second spot worldwide for niobium and the third respectively the fourth place for diamonds and palladium. The country is also rich in gold, copper, nickel, zinc and various other metals. There are, however, also critical metals that have not yet been extracted in Canada where supply chain problems exist or output rates are on the decline. The Canadian government lists a total of 34 minerals and metals that have been classified as critical for the country. Canada is trying to reduce deficits with its own mining projects (Fig. 3). Projects classed by the government as very important for progress and the economic development of the country are granted funding.


The Capex totalled 22.9 bill. C$ in 2023, this year this figure is set to increase by around 3 % to 23.6 bill. C$. Of the 22.9 bill. C$ spent, 77 % went on the mining sector and 23 % on the upstream sector (metal smelting and others) (Fig. 4). The mining sector is divided into metals and non-metals. Metals have a share of 11.7 bill. of the Capex, non-metals a share of 5.3 bill. C$. With regard to individual expenditure, that for gold and silver outweighs that for others with 7.5 bill. C$ in 2023, ahead of nickel-copper with 1.9 bill. C$ and iron ore with 1.1 bill. C$ and copper-zinc with 1.0 bill. C$. In this context, it is, however, striking how expenditure on exploration varies widely from year to year. For instance, for gold and silver the Capex increased by 15.4 % from 6.5 bill. to 7.5 bill. C$ in 2023, for 2024, however, a slump in the figures by a third to 5.0 bill. C$ is expected.


3 Key sectors of the mining industry

3.1 Potash

In Canada, potash is extracted mainly in the form of potassium chloride (MOP). It has so far been extracted in just ten mines in the province of Saskatchewan by the three producers Nutrien, Mosaic and K+S Potash Canada. In 2022, 23 876 Mta (million tonnes per annum) potash were produced on the basis of the MOP equivalent with a sales value of C$ 16 833 bill. Worldwide 40 Mta potash (K2O equivalent) were produced (Fig. 5). With 16 Mta, Canada reaches a global market share of 40 %, followed by China (6 Mta, 15 %), Russia (5 Mta, 12.5 %), Belarus (3 Mta, 7.5 %) and Germany (2.8 Mta, 5 %). In terms of exports, Canada takes a leading position with just under 50 %, followed by Russia with 16 % and Belarus with 9 %. Canada is planning to increase its output considerably. A BHP Billiton project, which is scheduled to go into operation in 2026, is contributing to this.


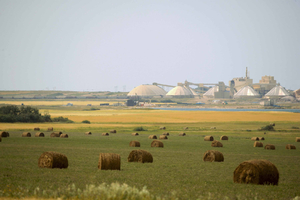
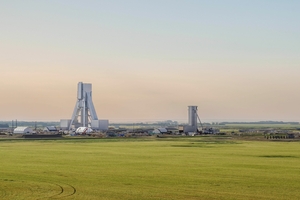
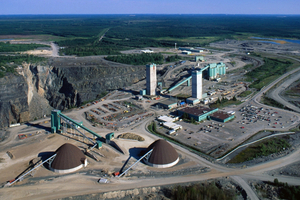
Market leader for potash in Canada and on the world market is the company Nutrien. In 2023, 13.2 Mta (MOP) were extracted. For 2026, the goal is to produce 15 to 16 Mta. Nutrien operates the six mines Allen, Cory, Lanigan, Patience Lake (Bild 6), Rocanville and Vanscoy Saskatchewan. The company most recently generated sales of C$ 29 bill. Besides potash, nitrogen fertilizers and numerous other products are produced. Number 2 on the market is Mosaic (The Mosaic Company) with the mining operations Esterhazy and Belle Plaine. In the second quarter of 2024, 2.35 Mt potash were produced. The German company K+S operates the Bethune Mine in Canada and is working together with Canadian Pacific Kansas City (CPKC), which has an annual output of 1.8 Mta. As a new competitor, BHP Billiton is entering the market with the Jansen Mine (Fig. 7) in 2026. The project has been running since 2021, has cost C$ 14 bill., and is set to produce 8.5 Mta once it is operating at full capacity.


3.2 Diamonds

The global production of raw diamonds fell in 2023 to 31.9 mill. carats from 34.6 mill. carats in 2022. The market leader Botswana alone reached a production of 24.7 mill. carats. With a production of 2.8 mill carats, Canada holds third place in the ranking behind Russia. Diamonds are mined in Canada in the Northwest Territories and the province of Quebec by the four companies Rio Tinto, De Beers Canada, The Arctic Canadian Diamond Company and Stornoway Diamonds. In the first six months of 2024 alone, De Beers has produced a total of 1.318 mill. carats in the Gahcho Kué (Fig. 8), Snap Lake and Victor mines in Canada. Gahcho Kué, just south of the Arctic Circle, has been in operation since 2016 in the fly-in/fly-out mode and is one of the largest new diamond mines in the world. Rio Tinto‘s Diavik Mine, also at Lac de Gras near the Arctic Circle, has also been making headline and produced 3.34 mill. carats in 2023.


3.3 Gold mining

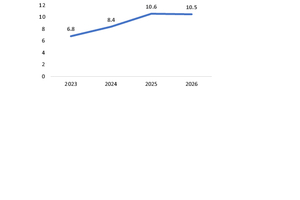
Worldwide, around 3644.4 t primary gold (from mining operations) were extracted in 2023. That is a slight plus of 0.54 % compared to the previous year, but short of the 3655.9 t extracted in the record year 2018. In 2023, Canada produced 191.7 t or 6.8 MOz (mill. ounces) gold, behind Australia with 10.6 MOz, China with 10.4 MOz and Russia with 8.4 MOz. Canada has the largest gold reserves worldwide with around 920 MOz. Gold was mined in 2023 predominantly in the three provinces of Ontario (2.5 MOz), Quebec (1.8 MOz) and Nunavit (0.8 MOz). Other key provinces are British Columbia, Yukon and Manitoba. S+P Global Market Intelligence has forecast Canada’s gold mining based on historical data and the current mine expansions (Fig. 9). According to this, gold mining will increase from 6.8 MOz in 2023 to 8.4 MOz this year and 10.5 MOz in 2026.


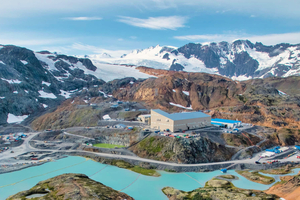
Market leader in Canada’s gold mining is Agnico Eagle. At its seven gold mines La Rone, Malartic and Goldex in Quebec, Detour Lake and Macassa in Ontario as well as Meliadine and Meadowbank (Fig. 10) in Nunavut, it has produced 2.753 MOz gold alone. The company is investing in five other projects in Canada, including the Wasamac and Upper Beaver projects in the Abitibi Gold Belt in the Province of Ontario. As well as in Canada, the company owns gold mines in Australia, Mexico and Finland. In 2023, the company produced a total of 3.44 MOz gold. Second place in the ranking in Canada goes to Newmont, following the takeover of Newcrest, which operates the gold mines Brucejack (Fig. 11), Éléonore, Musselwhite, Porcupine and Red Chris, where a total of 0.706 MOz gold was produced in 2023. The most important mines Éléonore, Musselwhite and Porcupine were sold again in February 2024 as a result of losses.


3.4 Base metals, PGM and cobalt

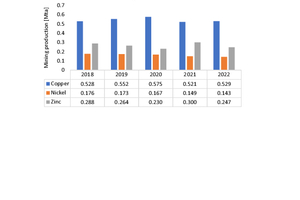
Canada is rich in other mineral resources, especially base metals like copper, nickel, zinc and other key resources like the platinum group metals (PGM) and cobalt [2]. Fig. 12 shows the development of Canada’s production for the base metals copper, nickel and zinc. In the case of copper, 0.529 Mta were extracted in 2022. On worldwide scale, around 22 Mta copper were produced, which puts Canada with 2.4 % of the production in just 12th place behind countries like Chile (24.1 %), Peru (11.0 %), DR Congo, China, and the USA. In Canada, copper is produced mainly in the four provinces of British Columbia (288 kt), Ontario (160 kt), Newfoundland (21 kt) and Manitoba (20 kt). Canada‘s copper exports in 2022 were valued at C$ 9.4 bill. Besides direct copper mines, copper is also recovered as a by-product in the production of gold, molybdenum, nickel and zinc.


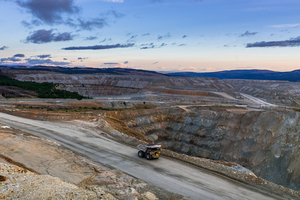
The most important copper producers in Canada are Taseko Mines, Teck Resources, Vale Canada and Glencore. Taseko Mines leads in the ranking with an output of 123 kt from the Gibraltar Copper Mine, the second largest surface mine in Canada. In second place follows Teck Resources, which, with the Highland Valley Copper Mine (HVC) (Fig. 13), achieved an output of 98.8 kt in 2023, down on the 119.1 kt in 2022. Production there is set to be doubled from 2024. The next spots are taken by Vale and Glencore. Vale operates the mine complexes Sudbury, Thomson and Voisey’s Bay and generated 79.4 kt, of which 7.2 kt were bought in from third parties. Glencore has no direct copper mine in Canada, however, it recently produced 22.6 kt copper concentrate from the zinc mines Matagami and Kidd, although the Matagami Mine has ceased operation in the meantime. Other relatively large copper producers are Hudbay, Newmont and Centerra Gold.


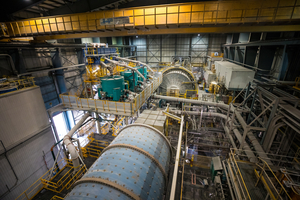
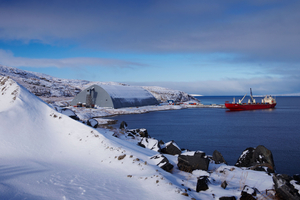
For nickel production, with 143 kt, Canada reaches around 3.9 % of the global production of 3.3 Mta, and with this share, the country takes sixth place in the ranking behind Indonesia, the Philippines, Russia, New Caledonia and Australia. Nickel is produced in the provinces of Ontario (71.3 kt), Quebec (31.1 kt), Newfoundland (19.1 kt) and Manitoba (13.7 kt). The two biggest producers are Glencore and Vale. Glencore runs the Integrated Nickel Operations (INO) with the Sudbury, Raglan (Fig. 14) and Nikkelverk Mines, and it produced a total of 39.1 kt in 2023. In the Murrin Murrin complex, another 31.1 kt are produced so that Glencore reaches around 50 % of Canada’s output. Vale produced 59.5 kt in the Sudbury, Thomson and Voisey’s Bay Mines in 2023, with 38.2 kt (64.2 %) coming from the Sudbury Mine.


At the last count, Canada produced 247 kt zinc, so with a global production level of 13.0 Mta, the country reached 1.9 % or sixth place in the ranking behind China, Australia, Peru, India and the USA. Zinc mines are located in the provinces of Manitoba, Ontario, Quebec, British Columbia and New Brunswick. The most important zinc mining companies in Canada are Glencore, Hudbay and Trevali. Besides these, there are numerus other companies that produce zinc as a by-product e.g. from gold or copper production, like Agnico Eagle or junior mining companies like Norzink, which are driving new mining projects. In 2023, Glencore extracted 38.6 kt nickel at the Kidd Mine (Fig. 15). Hudbay reached 34.6 kt with the Snow Lake zinc and gold mine in Manitoba. In 2022, on account of financial problems, Trevali gave up its operation of the Caribou Mine to FTI Consulting, which is selling the mine on. In 2023, Agnico Eagle extracted 7.7 kt nickel at the LA Ronde Gold Mine.


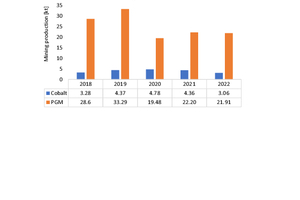
Fig. 16 shows Canada’s production of PGM (Platinum Group Metals) and cobalt in kilotonnes (kt). In 2020, Canada produced 21.91 kt PGM. Palladium accounts for around 15 kt and platinum for 5 kt. In the global production of palladium of 210 kt, Canada ranks in third place with 7.1 % behind Russia (88 kt), South Africa (80 kt) in the global ranking, but ahead of Zimbabwe (11 kt) and the USA (10 kt). The market leader Impala Canada (previously known as North American Palladium) was taken over by Impala Palladium (Implats) in 2019. The company operates the Lac-de-Iles Mine (Fig. 17) in Ontario and produced a total of 227.5 kOz palladium and 16.5 kOz platinum there. Glencore, the No. 2 on the market, reached 66 kOz palladium and 24 kOz platinum with its INO operations in Canada. For cobalt, with an output of 3.9 kt in the global production of 190 kt, Canada takes fifth place, with a 2.1 % market share. Global market leader here is the DR Congo with over 2/3 of the global production.


3.5 Canada’s international mining activities

Canadian companies have huge mining assets abroad (Fig. 18). The figure shows the asset values of the Canadian mining companies in different regions for the years 2021 and 2022 in bill. US$. While the number of assets fell from 1088 to 1075, the asset values abroad increased from 192.2 bill. US$ to 214.7 bill. US$. The biggest mining asset values exist with 70.5 bill. US$ in South America, followed by the USA with 44.7 bill. US$ and Africa with 37.0 bill. US$. Europe and Oceania (incl. Australia) reach just a modest 8.1 and 6.1 bill. US$. Interesting is if all the asset values in Latin America (South and Central America and Mexico) are added up, then for 2022 you get asset values amounting to 105.6 bill. US$, which are almost identical to the asset values in Canada of 105.5 bill. US$. The American assets of the Canadian mining companies make up a total of 255.8 bill. US$ or 80 % of the assets.


As an example of a leading Canadian company, we have chosen First Quantum Minerals. First Quantum is a global copper company that makes copper concentrate, cathode and anode copper worldwide and also produces gold, nickel and cobalt as by-products. The company employs around 20 000 people worldwide and operates mines in Peru, Argentina, Panama, Australia, Mauretania, Zambia, Finland, Spain and Turkey, although not in Canada, and generated a turnover of C$ 6.456 bill in 2023. In that year, 708 kt copper, 26.3 kt nickel and 226.9 kOz gold were produced. Flagship mine is Cobre Panama (Fig. 19) with the extraction of 330.8 kt copper in 2023. The mine there, 90 % of which is owned by First Quantum while 10 % belongs to the Korean company Komir, is to be expanded in the scope of the CP100 Project to achieve an annual ore extraction of 100 Mta.


4 Outlook for Canada’s mining industry

Canada’s mining industry is in an excellent shape and is regarded worldwide as a model example for its combination of leading technologies and consideration and inclusion of indigenous people. But how does the future of mining look in Canada? The Mining Association of Canada provides an insight [1]. Fig. 20 shows the development of some critical metals for the period from 2012 to 2022. The substantial decline is in the production of graphite, nickel and cobalt are certainly very significant. Copper comes off relatively well, while for lithium and rare earths, despite the efforts being made, no production has yet resulted. It is also interesting to look at the development of detected and expected reserves of raw materials (Fig. 21). Almost all important metals apart from copper show considerable losses here. Only gold mining with an increase in reserves of 110 % comes off exceptionally well. This is certainly a reflection of the huge efforts in the sector.

Literature

[1] Mining.ca: The Mining Story 2024 – Canadian Mining Industry Facts and Figures. The Mining Association of Canada (MAC), Published 31.05.2024, Ottawa/Canada

[2] Harder, J.: Prospects and trends – North America’s mining industry in the spotlight. AT MINERAL PROCESSING, 5/2019, pp. 32-45

Author:

Dr.-Ing. Joachim Harder, OneStone Consulting Ltd, Varna/Bulgaria

x

Related articles:

Issue 07-08/2024 From coal to lithium

What will the future bring for mining in Australia?

1 Overview of Australia’s mining sector Australia plays a key role in the production of raw materials like iron ore, coal, bauxite, gold, base metals and lithium. In 2023, with an estimated...

more
Issue 09/2021 Africa's mineral resources

Current hotspots in the African mining industry

1? Introduction Around one third of the world’s mineral resources are deposited in Africa. For diamonds, gold, platinum group metals (PGM), cobalt, vanadium, chromium and manganese ore, the continent...

more
Issue 07-08/2023 Market trends

Developments in the mining sector in Turkey

1 Economic development in Turkey Despite considerable economic and export growth, the economic situation in Turkey does not seem to be improving. Factors contributing to this are a high inflation...

more
Issue 10/2011

Recovery

Canada’s mining industry experiencing an upswing

1 Introduction In comparison with the Euro countries, Canada’s economy suffered little damage during the recent global economic crisis. The average real economic growth was 2.1?% between 2000 and...

more
Issue 09/2023 Turn of the times

Development of the mining sector in India

1 Economic development India is now the fifth largest national economy in the world and, with sustained growth, it will rank third behind the USA and China by the end of this decade. Despite...

more