Is there a future for this fuel?
Does coal have a future? Yes and no, depending on what time period you’re looking at. Yes, if you’re looking at the near future up to 2040; no, if you are looking at the decades after that. This report delivers facts on how the future demand for coal is developing and what the key political, economic and technological conditions are.
1 Introduction
At the UN Climate Conference (COP21) in Paris, 195 countries signed up to the first comprehensive and legally binding climate agreement. This agreement came into effect in November 2016. In the agreement, the governments of the countries have pledged to limit greenhouse gas emissions to the extent that global warming remains under two degrees up until the year 2100. Where possible, even the 1.5-degree mark compared to pre-industrial levels is to be achieved. Seven years after the Paris Agreement, the situation, however, is already looking gloomy. The latest UN climate report [1] has attested that world is steering towards global warming of 2.7 degrees by the year 2100 and the governments have missed their mark. In its current analysis [2], the Intergovernmental Panel on Climate Change (IPCC) expects the critical mark of 1.5 degrees will probably be reached in the year 2030. How does the trend in coal consumption fit in with this?
2 Overview of the coal sector
According to the BP “Statistical Review of World Energy 2022” [3], global primary energy demand has grown in 2021 by 5.8 % and by 1.3 % compared to the 2019 figures. The CO2 emissions from energy consumption and industrial processes (as CO2 equivalent) increased in 2021 by 5.7 % to 39.0 Gt CO2e, with an increase in the pure CO2 emissions from energy consumption by 5.9 % to 33.9 Gt CO2, close to the 2019 level. The worldwide coal consumption has, according to the BP, increased by 6 % to 160 exajoules (EJ), that is more than in the year 2019 and corresponds to the highest consumption since 2014. In the global energy demand in 2021, coal took a share of 26.9 % (Fig. 1), that is somewhat lower than that of oil consumption, but higher than that of natural gas consumption. Overall, in 2021, around 440 million tonnes coal per year (Mta) more than in 2020 were produced and consumed.
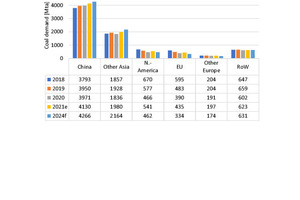
Fig. 2 shows how global coal consumption will develop up to 2024 according to the International Energy Agency (IEA) [4]. After consumption plummeted as a result of Covid pandemic by around 4.4 %, it grew again by 6.0 % in the year 2021. Global consumption is set to grow from 7906 Mta at present to 8031 Mta in the year 2024. China had a share of 52.2 %, that is the highest share in consumption in 2021, followed by the rest of Asia with 25.0 %. The EU reaches just 5.5 %, the rest of Europe (without CIS states) 2.5 %. North America (Canada, Mexico and the USA) make up 6.8 %, the Rest der Welt (RoW) 7.9 %. By 2024, China and the rest of Asia will increase their shares to 53.1 % and 26.9 %, respectively, while the EU, the rest of the Europe and North America will fall back to 4.2 %, 2.2 % as well as 4.8 %, respectively.
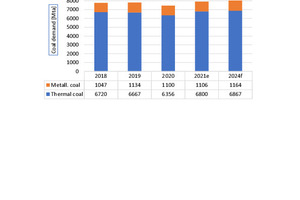
Fig. 3 shows how, according to the IEA figures, worldwide consumption is broken down over coal demand. A differentiation is made between steam coal and coking coal. Steam coal or thermal coal is used in power plants, primarily for the generation of electricity and in smaller quantities for the heating sector (cogeneration plants, aluminium, cement and chemicals industry, etc.). Coking coal or metallurgical coal and coal dust are used in the steel industry for the production of pig iron in blast furnaces. Currently, a good 70 % of the global pig iron is produced in blast furnaces. As Fig. 3 clearly shows, in 2019 around 85.5 % of the coal demand was for steam coal (Fig. 4) and 14.5 % for coal for coking. These percentages will only change insignificantly in the next few years, after in 2021 the share of steam coal rose slightly to 86.0 % in 2021.
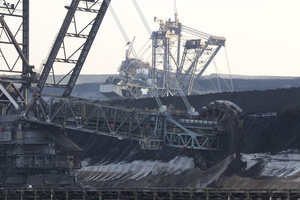
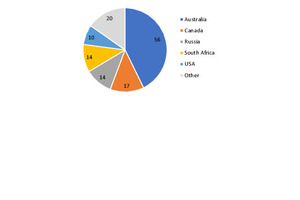
Some time ago, the UN tabled the idea that coal mining worldwide would have to be reduced annually by around 11 % by 2030 to achieve climate goals. The facts, however, present a different picture. We are currently seeing a big wave of new mine projects, as the IEA recently reported. In 11 countries, a total of 131 new coal mines are planned, and that without even taking China into account (Fig. 5). Australia alone reports 56 new projects, followed by Canada with 15 and South Africa and Russia with 14 each and the USA with 10 projects. Other projects are planned, for instance, in Indonesia, Colombia, Mongolia and Mozambique. Some the projects are intended to replace exhausted mines, but a not insignificant percentage can, however, but attributed to a demand for higher extraction rates.
3 Developments in coal-fired power plants
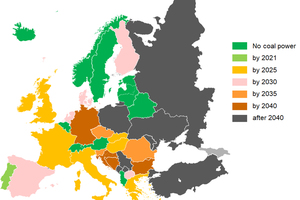
In Germany and in Europe, the phasing out of coal has a high political and social priority Fig. 6 shows the current decisions of country governments on coal phase-out in the power plant industry in Europe. According to this, with the exception of Poland, the European power plant sector will be coal-free already by 2040. Europe is therefore a forerunner on the global scale. In this context, it is worth pointing out that at COP26 conference in Glasgow in 2021, 40 nations signed up to phasing out coal, but these nations account for less than 21 % of global coal-fired electricity generation, because countries like China, India, the USA, Japan and Russia are not included and, in addition, in many countries, a phase-out will only be realized after 2040.
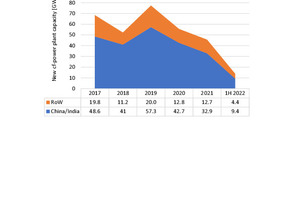
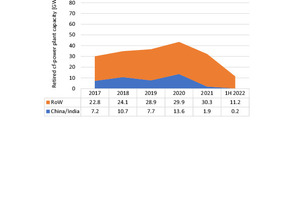
It is very informative to compare the figures from the “Global Energy Monitor” [5] for those coal-fired power plants erected in the last few years with the data of the coal-fired power plants that have been decommissioned. From 2017 to the first six months of 2022, according to the “Global Coal Plant Tracker, July 2022”, 312.8 GW in new coal-fired power plant output was installed. Of this total, China and India alone accounted for 74.1 % and the rest of the world 25.9 %. The newly installed coal-fired power plants contrast with only 188.5 GW of decommissioned capacity in the same period. China and India accounted for 21.9 % of this decommissioned capacity, the rest of the world for 78.1 %. Accordingly, in a gross-net analysis of the period from 2017 to the first six months of 2022, China and India have increased their coal-fired power plant capacities by 190.6 GW while the rest of the world has reduced capacities by 66.3 GW.
Fig. 7 shows the data for the newly installed capacity in coal-fired power plants. 2019 was probably the last peak year with a total of 77.3 GW new power plant capacity. In 2020, this figure fell to 55.5 GW and in 2021 to 45.6 GW. It should be noted that the erection or commissioning of such power plants is preceded by an average planning time of around ten years and that the power plants can be operated for 25 to 40 years. Fig. 8 shows the data for the decommissioned coal-fired power plants. A peak year can be identified in 2020. In 2021 and in the first half year of 2022, the figures levelled off considerably, which may have to do with the energy crisis and the development of gas prices since 2021. For instance, in summer 2022, the decision was taken in Germany to put energy supply on a broader footing with the increased use of coal-fired generated power. Some companies have already recalled retired coal workers.
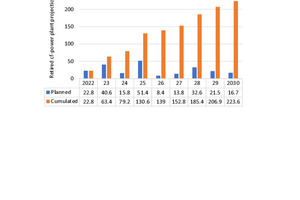
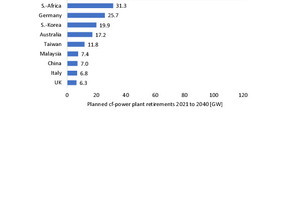
How will things continue with the decommissioning of coal-fired power plants? Fig. 9 shows the capacity closures for coal-fired power plants planned globally each year and how this impacts the cumulative figures. According to this, from 2022 to 2030, a total of 223.6 GW installed power plant capacity will be decommissioned, either because of scheduled decommissioning at the end of plant operating lifetime or premature decommissioning of power plants and power plant units. It is evident that up to the year 2025, a certain increase in decommissioning planned, which will tail off up to 2027 and then increase again up to the year 2030. Fig. 10 contains a list of those countries decommissioning the largest coal-fired power plants from 2021 to the year 2040. The TOP10 list is headed by the USA, followed by South Africa, Germany, South Korea and Australia.
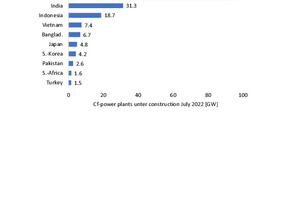
The big unknown in the development of the coal-fired power plants is the added capacity of new power plants. In the “Global Energy Monitor”, for July 2022, a total of 178.1 GW of coal-fired power plants were reported to be under construction. The list (Fig. 11) is headed by China, followed by India, Indonesia, Vietnam and Bangladesh. With a capacity of 93.8 GW, China accounts for 53.1 % of the total power plant capacity under construction. In the meantime, China, Japan and South Korea had pledged not to support any new international coal-fired power plant projects. Accordingly, for some countries, especially from the Asian and African regions, financial support for such projects will be lost.
4 Developments in the steel industry
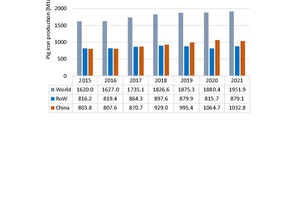
The worldwide demand for pig iron is growing constantly. Fig. 12 shows the development since 2017, China accounting for the main market growth. In 2021, production stood at around 1952 Mta, China taking a share of 54 % in this [6]. For 2030, a slight market increase to 2 100 Mta has been forecast, which will stabilize at this level up to 2040, before falling to around 2000 Mta by 2050. That corresponds almost to the level of 2021. However, there will be changes in the weighting of the regions compared to today. China will drop back to a share of around 34 %, while India and other developing countries will experience considerable increases, whereas the developed countries will continue to stagnate.
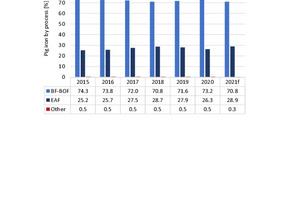
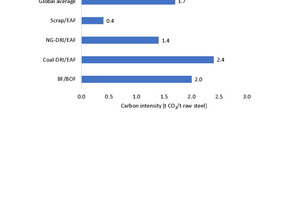
Fig. 13 shows how pig iron production is currently distributed over the main processes. The most common process with over 70 % global market share is an integrated steelwork with blast furnace and BOF steel converter (BF-BOF) for the production of pig iron and subsequent conversion to crude steel. Electric arc furnaces (EAF) reach a market share of around 29 %. The steel industry is currently responsible for around 11 % of the global CO2 emissions [7]. The corresponding CO2 emissions depend to a large extent on the selected process (Fig. 14). Conventional BF-BOF processes demonstrate a specific emission level of 2.0 t CO2/t crude steel. The lowest value of 0.4 t CO2/t crude steel is reached with EAF processes that use scrap steel instead of iron ore for steel production. The availability of scrap steel is, however, increasingly limited [8].
Table 1 shows what blast furnace capacities are currently planned according to information from the “Global Energy Monitor”. In total, these add up to over 200 Mta, in countries that have all made CO2 pledges, however, only from 2050. The list is headed by China, which with 159.6 Mta accounts for almost 80 % of the total on its own. In the list, along with India, Vietnam, Indonesia, Malaysia, Myanmar and Brazil, there are six other countries. In other lists, countries like Cambodia, Russia and Ukraine are included. It should be noted that blast furnace projects compete with other iron production processes like direct reduced iron processes (DRI). DRI processes, however, so far require superior iron ore qualities, the availability of which, however, is limited [9].
Accordingly, it is difficult to predict the steel industry‘s future coal demand as coal is only used in the BF-BOF processes and coal-based DRI/EAF processes. The future coal demand therefore depends essentially on which processes prevail (Fig. 15). Moreover, opinions within the industry differ. BHP Billiton expects that BF-BOF processes will still dominate the market in 2050, whereas Bloomberg New Energy Finance expects that Direct Reduced Iron (DRI) process will have a market share of 59 % in 2050. Ultimately, the development is largely influenced by how the economic costs for the processes develop and whether the raw materials are available, like scrap iron for EAF processes and “high-grade” iron ore with Fe content > 67 % for DRI processes.
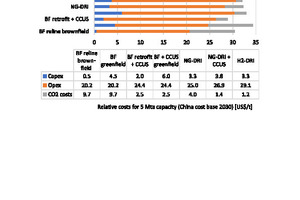
An up-to-date overview of the economic costs is available from Teck Resources (Fig. 16) [10]. This includes the net investment costs, net operating costs and CO2 levies on a cost basis by 2030 for the most important steelmaking variants in China. The lowest investment and operating costs are reported for blast furnaces that have been relined, these, however, incur the highest CO2 levies. The highest operating costs are incurred for the DRI plants that use hydrogen as a fuel. The highest Capex costs are for blast furnaces combined with a CCUS technology (CCUS = Carbon Capture, Utilization and Storage). If all cost elements are taken into account, the use of existing blast furnaces in combination with the CCUS technology presents the most cost-efficient alternative. The most expensive alternatives are new blast furnace plants on account of high CO2 levies.
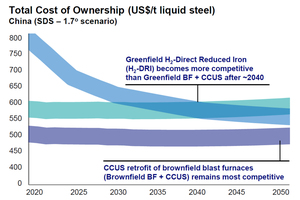
The use of existing blast furnace plants together with CCUS technologies is now regarded as the fastest and lowest-cost alternative, at least for the Chinese steel industry. Fig. 17 shows the total operating costs in US$/t liquid crude steel plotted over the next years. The costs for the BF-CCUS-brownfield variant range between around 475 and 540 US$/t liquid crude steel, whereas the costs for the corresponding greenfield variant are at least 100 US$/t above this. The costs for the H2-DRI variant currently lie well above this. To be competitive, the costs for the production of hydrogen would have to fall to the region of 1 – 2 US$/kg. For industrial-scale hydrogen production, this should probably be the case only after 2040 [10]. The investment costs for electrolysis plants would have to fall by 80 %.
5 Outlook
The outlook for the coal industry is good to very good at least up to 2040. This applies to all types of coal, including hard coal and lignite (Fig. 18). For the years after 2040 to 2050, there are still prospects in many regions of the world and especially in China, India and Southeast Asia. With regard to development after 2050, it is difficult to make any predictions from today’s perspective. Overall, it can be expected that the further use of coal will largely depend on whether it is possible to combine coal-fired power plants and blast furnaces with CCUS technology both with regard to economic and technological terms. Higher CO2 levies will favour CCUS-technologies. According to many industry sources, there are sufficient underground storage options for CO2 with a capacity up to 5 Tn t CO2.
Literature
[1] UN Climate Report: United in Science 2022 – A multi-organization high-level compilation of the most recent science related to climate change, impacts and responses. 14.09.2022, United Nations, New York/USA, in https://public.wmo.int/en/resources/united_in_science
[2] Lee, J.-Y, Marotzke, J.: Chapter 4. Future Global Climate: Scenario-based Projections and Near-term Information, 14.09.2022, IPCC (Intergovernmental Panel on Climate Change), Geneva/Switzerland
[3] British Petrol: BP Statistical Review of World Energy 2022 – 71st edition. BP plc, London/Great Britain
[4] IEA: Coal 2021 – Analysis and forecast to 2024, IEA (international Energy Agency), 16.12.2021, Paris/France
[5] Global Energy Monitor: Boom and Bust Coal 2022 – Tracking the global coal plant pipeline. 29.04.2022. Global Energy Monitor, San Francisco/USA
[6] Worldsteel: 2022 World Steel in Figures, 13.06.2022, World Steel Association, Brussels/Belgium
[7] Swalec, C.: 2022 Pedal to the Metal – IT’S NOT TOO LATE TO ABATE EMISSIONS FROM THE GLOBAL IRON AND STEEL SECTOR, 15.06.2022. Global Energy Monitor, San Francisco/USA
[8] Harder, J.: Vision and reality of the circular economy. recovery – Recycling Technology Worldwide, 5/2022, pp. 60-73
[9] Harder, J.: Mining trends – Dry beneficiation of iron ore. AT MINERAL PROCESSING, 6/2022, pp. 62-72
[10] Teck: Steelmaking Coal Resilience. Investor Presentation 07.04.2022, Teck Resources Limited, Vancouver, B.C./Canada
Author:
Dr.-Ing. Joachim Harder, OneStone Consulting Ltd., Varna/Bulgaria
Joachim Harder studied process engineering at Braunschweig University of Technology and earned his Ph.D. there. After more than 10 years working in industry in various management posts, in 1997 he established the consulting company OneStone Consulting. Dr. Harder is an acknowledged expert in international marketing, specializing in market analysis for business segment strategies. He is the author of diverse publications and a popular conference speaker.


![15 Projected EAF market shares [7]](https://www.at-minerals.com/imgs/1/8/7/8/7/8/6/tok_7c6bfda51bcedd88df9c94cd6595c845/w300_h200_x297_y421_15_Harder_EAF-f92de34ca3535f69.jpeg)
