Cost estimates for safety in the workplace
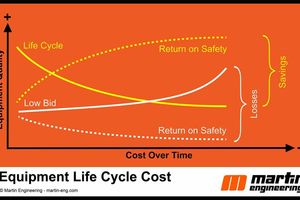
When companies buy on price (Low Bid) the benefits are short-lived and costs typically increase over time. In contrast, when purchases are made based on lowest long term cost (Life Cycle Cost), benefits usually continue to accrue and costs go down, resulting in a net savings over time (Fig. 1) Safer and more reliable equipment is easier to service, has a longer life and is less expensive to maintain.
Organizations that embrace safety show significant performance advantages over the competition. The proof is reflected in reduced injuries and greater productivity, along with above industry average financial returns and higher share prices. Justifying safety investments is greatly enhanced by quantifying what most financial managers refer to as “intangible costs”, i.e., injuries, lost labor, insurance, morale, legal settlements, etc. However, managers and accountants have been trained to think about saving direct costs to justify investments.
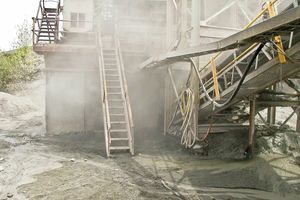
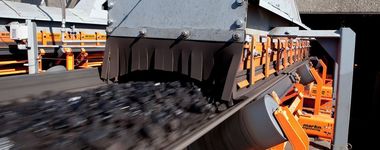
When conveyors don’t operate efficiently they have unplanned stoppages, release large quantities of fugitive materials and require more maintenance (Fig. 2). Emergency breakdowns, cleaning of excessive spillage and reactive maintenance all contribute to an unsafe workplace.
Safety Pays
Numerous case studies revealing the positive relationships between safety and productivity are backed up by organizations that gather global statistics on accidents and incidents. The simple formula for return on investment (dividing savings by cost) does not capture the potential savings from safety investments. Several organizations provide detailed and regional statistics on the cost of accidents (Table 1)
Lacking specific historical data, managers can turn to numerous reliable sources that provide the probability of incidents that can be used to estimate tangible and intangible future costs (Table 2). The financial technique used to compare options is called a “net present value” (NPV) analysis. NPV compares different investment options with varying costs and savings (cash flows) over time, discounting them by the company’s cost of money. For example, an internal risk analysis shows a facility has 30 workers exposed to conveyor hazards. The estimated probability of the different classes of accidents (fatal, lost time and first aid) is multiplied by the cost of these accidents to reveal what could be invested to reduce the incident rate by half (Table 3).
Assuming the life of the conveyor is 20 years and the cost of money (discount rate) is 5 %, the available additional investment would be about US$ 750 000 more in design time to accomplish the 50 % improvement in safety. By choosing the lowest-priced bid to meet the minimum safety requirements, the short-term expenditure ends up costing considerably more over the 20-year lifecycle (Table 4). By spending US$ 750 000 more to exceed the minimum safety and design requirements and reduce the accident rates by 50 %, the annual projected cost of accidents drops from US$ 140 813 to US$ 70 407.
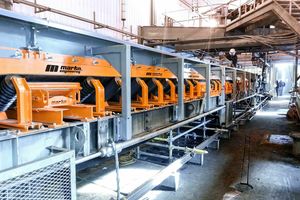
Measured in today’s dollars – including the additional investment of US$ 750 000 – the projected savings over the 20-year term at 5 % are about US$ 1.2 million by investing more upfront. If, after further analysis, the savings are found to be less – perhaps only a 25 % reduction in the cost of accidents – the upfront investment is still justified over the long term. Even though it takes a little more effort to collect data and do a financial analysis, in the end, NPV consistently proves that safety does indeed pay (Fig. 3).

