Analytical determination of the horizontal radial force application point on the conical head of a gyratory crusher
 © FLSmidth
 © FLSmidth
 © FLSmidth
 © Unland
 © Unland
 © Unland
 © Unland
 © Unland
 © Unland
 © Unland
![Table 2: Force application angle δ [°] (180° = π) as a function of the comminution zone εa to εe and the exponent n (some values from [7])](https://www.at-minerals.com/imgs/2/2/0/0/6/4/3/Tabelle_02_Unland_1-8382d17521cc6a64.jpeg) © Unland
© Unland
![9 Force-displacement curve for diorite sample no. 31 [12]](https://www.at-minerals.com/imgs/2/2/0/0/6/4/3/09_Unland-7-bfb1ee337ef6ff1d.jpeg) © Unland
© Unland
![10 Force-displacement curve for diorite sample no. 25 [12]](https://www.at-minerals.com/imgs/2/2/0/0/6/4/3/10_Unland-8-70062918d90ecdc1.jpeg) © Unland
© Unland
 © FLSmidth
For calculation of the drive torque and drive power, and design of the machine elements of gyratory crushers, a knowledge of the forces and their points of application is needed. The comminution forces acting on a crusher head can be substituted by a horizontally applied resulting force. This force acts offset by an angle to the narrowest gap. In operation with a filled crushing chamber, this angle measures around 30° to 40°. With partial filling of the crushing chamber on one side with few very hard rocks, this angle can be almost halved.
1 Introduction
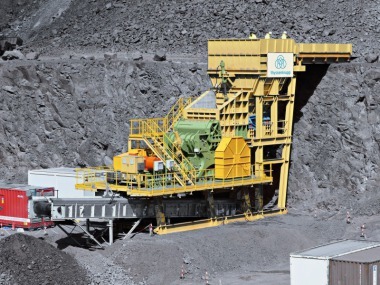
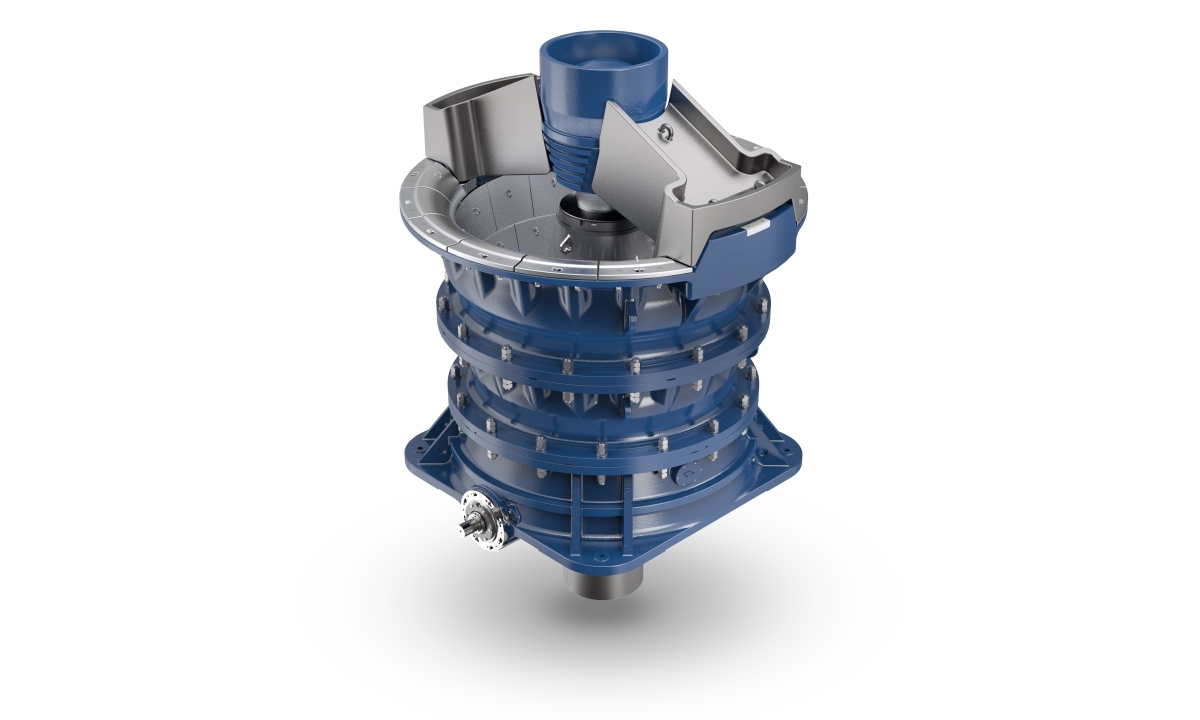
Gyratory crushers, also referred to as primary gyratory crushers, primary cone crushers, round crushers, cone crushers, short-stroke cone crusher or Gates crusher [3; 4; 5; 11], are used as primary crushers in raw material extraction operations (mines, quarries) wherever large throughputs of brittle-fracture rocks or ores have to be crushed (Fig. 1). In special cases, these crushers are also employed as secondary and tertiary crushers. Comminution is effected in an annular crushing chamber which is formed from a gyrating, upwards diameter reducing crusher head and a fixed crusher shell shaped like and upwards diameter enlarging cone.
The feed material is crushed between the conical crusher head and the crusher shell (Fig. 2)as the crusher head intermittently approaches the crusher shell. As the crushing chamber opens, the crushed product falls or slides further down the crusher and ultimately falls out of the crushing chamber. The crushed product passes through the crushing chamber vertically, virtually in stages, and is subject to cyclic comminution, transport and classifying processes.
The dimensioning of these crushers is based on different methods. Goals are the required performance data, like the throughput or product particle size, but also sufficient drive power and mechanical strength of the machine to handle the characteristics of the feed material, likes its strength, particle size and particle shape distribution. The methods applied here can be roughly divided into three groups, like the use of empirical data gained in the practice, data derived from hypotheses or sizing diagrams [3; 13], and the application of analytical [2; 11] and numerical methods [1; 6]. Each of these methods enables dimensioning, although their information value differs. The processes in the crushing chamber constantly change both spatially and temporally. To a certain extent, there is a double “discretization” of the processes. These processes can be determined with numerical methods, e.g. DEM. The disadvantages lie, however, in the determination of the many parameters, some of which are difficult to determine and some of which cannot be determined at all and therefore can only be estimated, as well as in the assessment over relatively long periods of time. While the empirical methods and those based on hypotheses do not enable a discretization, they do have the major advantage that practice-relevant design parameters can be derived from easily obtained measured results. The analytical methods can represent the processes in the crusher chamber in steps, but not a discretization like that occurring in reality. Compared to the characteristic-value-based methods, the analytical methods have the advantage that functional correlations can be developed and assessed. For this reason, the analytical method has been chosen in this paper.
Determination of the required drive torque and the drive power is based crucially on the load assumptions at the crusher head. In the following, therefore, the radial load assumptions are determined and discussed. For this, first a simplified model is created, and then this is discussed and its plausibility tested in respect of the point of radial force application.
2 Principle of operation
The crushing chamber of a gyratory crusher is open at the top and bottom and bounded radially by the crusher shell and crusher head. Depending on the design, periodically the position of the crusher shell and crusher head changes. This paper references the most common design. The crusher shell is fixed in place while the crusher head performs a gyrating motion, which is determined kinematically at the top by a spider bearing and at the bottom by an eccentric shaft. Ideally, the crusher head does not turn on its own axis. In practice, however, the conical head performs compensating movements on its own axis (see Fig. 3).
The cross-section of the crushing chamber can be divided in four sectors.
It consists of two rotating, symmetric, laterally reversed crescent-shaped cross-sections (Fig. 4). In the gap that narrows in the direction of rotation (Sectors I and II), the feed material is crushed. As the gap widens again (Sectors III and IV), the product falls out of the crusher. In a vertical direction, the material passes through the crushing chamber from the top with the largest gap and the smallest radial movements, moving downwards to be comminuted stepwise in the direction of the discharge, where the gap is smallest, but the stroke is biggest. The crushing chamber geometry, which changes during gyration but is repeated intermittently with every rotation, and the speed must be coordinated with each other to allow the compaction and comminution of the crusher feed locally in the crushing chamber but also prevent the formation of solids bridges over locally fully compacted crushed product between the shell and head. This would lead immediately to a halt of the crusher operation and to triggering of the torque limit.
3 Bounds for creating a substitute model
The comminution of a particle takes place in limited space and time in the crushing chamber (so-called double “discretization”). The contact surfaces of the crusher head with the particles are therefore also loaded in a limited space and time. If, however, the comminution processes of the particles passing through the crushing chamber are analysed over a longer period, the surface of the conical crusher head is loaded as if by a distributed surface load. This distributed surface load acts like pressure on the surface of the conical crusher head. It forms to a certain extent a “load mountain range” on the crusher head. Ideally, the pressure should increase in a vertical direction from the feed inlet to the discharge and in the radial direction from the largest to the smallest gap in the crescent section in which the feed material is comminuted (Sectors I and II). The other crescent section (Sectors III and IV) is pressureless. In practice, the situation deviates from the ideal as, for instance, the spatial feed, the strength, the particle shape and particle size distribution of the feed material and crushed product in the crushing chamber vary or the frictional forces in the peripheral direction are exceeded. This leads to deviations in the pressure distribution both in the peripheral direction (processes in the two crescent sections are not strictly separated) as well as in the vertical direction (local compactions lead to local pressure increases). Fig. 5 shows a longitudinal and cross-section of an idealized “load mountain range”.
In practice, the distribution of pressure on the crusher head is subject to spatial and temporal fluctuations. A “steady-state“ operation of the crusher assumed for the calculation is therefore not given. The material fluctuations alone, the constantly changing granulometry of the feed material and the stepwise comminution in the crushing chamber prevents in principle the development of “steady-state” operation. These difficulties show that not one definitive design method exists. For this reason, a substitute model is to be developed, the results of which lie within a bandwidth. The method must therefore enable the identification of functional correlations between geometric and physical parameters. As a result, on the basis of parameter variation, it is possible to estimate their influence on the application point of the resulting breaking force on the crusher head, which is to be determined here. Equally, extreme cases can be considered and discussed.
4 Formulation of the substitute model
The substitute model assumes an ideal conical form of the crusher head and the crusher shell. The distributed surface load acting on the crusher head can be cumulated by a resulting substitute force Fr (Fig. 5). For the calculation of the application point, the horizontal force component Fres is the determining factor. Here it is assumed that the radial pressure distribution on the crusher head is initially the same qualitatively but not quantitatively over the total height (see Chapter 6 Discussion and consideration of the results). It can therefore be represented by a line load p(ε). The horizontal substitute force Fres acts then at height hers and in the peripheral direction at the angle δ on the crusher head (Fig. 5). The situation in the crushing chamber cross-section at the height hers is illustrated in Fig. 6.
The eccentricity r between the central axis of the shell and crusher head determines the stroke h and therefore the narrowest gap s (closed side setting CSS) and the largest gap s + h (open side setting OSS), with h = 2r. The centre point OK of the crusher head turns around the centre point OM of the shell, ideally without the crusher head turning on its own axis OK. It should be noted that all values reference the height hers and not the height of the material feed or the crushed product discharge or the eccentric sleeve.
The material is fed in the region of the largest gap and comminuted as a result of the movement of the crusher head. After passing the narrowest gap, the crushed product can fall out of the machine. The line load development p(ε) increases with the reducing gap and falls again with the widening gap. The pressure increase starts in Sector I at the angle εa. The crusher head is then under no pressure in Sector III after an angle Δε at εe. The resulting force application angle δ lies offset near to the narrowest gap. The resulting substitute force Fres forms a lever from r sin δ to the drive of the crusher head. Accordingly, the drive torque T and, with the speed n of the centre point OK of the crusher head around the centre point of the shell OM, the drive power P can be calculated. With provision for the losses and geometric relations, the drive torque and the drive power of the eccentric sleeve and then of the drive motor can be rated accordingly.
The substitute model proposed in this paper now assumes that there is no longer any radial force in Sector III. The pressure in the gap increases steadily in the peripheral direction from the largest to the smaller gap in Sectors I and II. With these preconditions, the following substitute picture results (Fig. 7):
According to this, the line load p(ε) acts in the angle range from εa to εe = π and the functional correlation with the acting angle ε generally follows an exponential function:
⇥(1)
with a characteristic value, the uniform line load p0 and the exponent n (see also [7]).
5 Calculation of the resulting substitute force and its point of application
The line load p acts in the angle range εa to π. The resulting force Fres is calculated from the integral of the line load p(ε) over the section of the perimeter formed by the angles εa and π (Fig. 8).
At an infinitesimally small peripheral section Rdε, at angle ε, the load p0εn acts and at an angle ε + dε the load p0(εn + dε), the mean is then .
For the angle range acted on by the line load dε, then the resulting line load pL applies:
⇥(2)
⇥(3)
As (dε)² << dε, (dε)² can be neglected so that
⇥(4)
For the resulting force, there results:
⇥(5)
⇥(6)
⇥(7)
For determination of the force application angle δ, it applies that the summations, i.e. the integrals of the line loads pL from ε = εa to π - δ and ε = π – δ to π must be the same:
⇥(8)
From this follows
⇥(9)
or
⇥(10)
and then the conditional equation for δ
⇥ (11)
For the simple special case n = 1 and εa = 0, for the resulting substitute force Fres, it applies
⇥(12)
as well as with the relation (11)
⇥ (13)
the angle δ
⇥ (14)
or
δ = 52.72° ⇥ (15)
The starting angle εa of the line load development p(ε) can vary, as can the exponent n. Table 1 provides an overview of the conditional equations and the qualitative curves of the line load developments p(ε). Depending on the angle εa and exponent n, the point of application lies at another angle δ. In addition, the conditional equations for the resulting force Fres and the uniform line load p0 are given. The evaluation can be performed in two respects. If p0 is regarded as a constant, the resulting force Fres changes in accordance with the conditional equations. For a constant resulting force Fres, the curve of p(ε) also changes on account of the change of p0. The corresponding angles δ remain unchanged.
Table 2 shows the evaluation for the force application angle δ for different starting angles εa and exponents n. For better readability of the values, the form of a matrix with numerical values has been chosen.
The force application angle δ therefore depends on the comminution zone εa to εe and the exponent n of the line load development p(ε). The influence on the angle δ is all the smaller, the smaller the comminution zone εa to εe and the bigger the exponent n are. For well-filled crushing chambers and for choke crusher feed, the starting angles εa lie at 0° to a maximum of 30°. Larger starting angles can be observed for poorly filled crushing chambers and single lumps of feed material.
6 Discussion and consideration of the results
The force application angle δ is a system property. The system is characterized by properties of the machine, the crusher product, the crusher feed and the interactions between them.
While material, geometry and kinematics of the crusher are given and defined and can only be changed within narrow boundaries or by modification, like stroke, gap, speed or contour of the conical crusher head, the material to be crushed can vary widely, even within one deposit.
The most important comminution properties of the material to be crushed can be divided into two groups, which influence each other to a certain extent. The first group comprises material properties, like the fracture behaviour (brittle or ductile), the strength (compressive, bending strength, point load index) and the microstructural properties (mode, structure, texture) of the material to be crushed. The second group refers to the geometric properties, like the particle size and particle shape distribution of the material to be crushed. It should be noted that many properties are coupled by physical effects, like the influence of the size and shape of the particles on the strength properties.
The type and arrangement of the material feed into the gyratory crusher also has a crucial influence on the force application angle. The crusher feed can be scalped or not prior to being fed to the crusher, spilled into the crusher or not with HGVs, belt or reciprocating plate feeders. The material to be crushed can be fed from one, two or three sides.
Finally, there are numerous interactions between the system parameters, like the cavity volume in the crushing chamber, which determines the mobility of the rock fragments. The force and energy input into the particles to be comminuted depends both on the contact geometry between them and working surfaces of the crusher as well as on their orientation in the crushing chamber.
For the force application angle δ, only trend statements are possible as many parameters vary in operation.
For estimation of the force application angle, brittle material behaviour is assumed. Most materials comminuted in gyratory crushers exhibit brittle fracture, like hard rocks or numerous ores. Characteristic for brittle material behaviour is a steep force displacement curve (σ-ε-curve) in a compression test, which ends abruptly with forced rupture. If the force is introduced into a feed particle via its corners or edges, comminution initially consists of many partial fractures, until the volume-reduced particle takes a position in which it can absorb relatively high forces. With the addition of further force, it then breaks suddenly [9; 10; 12]. The material behaviour can be described by the relation (1) of the line load p(ε) by the exponent n. For brittle material behaviour, then initially applies:
n » 1⇥(16)
The force-displacement curves of the particles are, however, also system properties. The curves in Fig. 9 and Fig. 10 show by way of example the different comminution behaviour of a typical hard rock (diorite, compressive strength 180 to 240 MPa) from the Hohwald deposit in Saxony [12]. Two diorite samples of the 140/200 mm fraction from the aggregate material obtained in a limited blasting strike were crushed in a test rig by means of compression. The force displacement curves p(ε) were plotted.
While Sample no. 31 showed a particle shape angle of 164° so that the rock lies almost completely flat on the surfaces of the testing device, the contact of Sample no. 25 was characterized by a particle shape angle of 128° and therefore by an edge contact. Sample no. 31 initially shows a steep force development, which could be represented with an exponent n » 1. Then it shows a forced fracture to then exhibit numerous smaller fracture events on a relatively high force level. This part of the curve could be described globally with an exponent n = 0. Sample no. 25 tends to show a lower force increase. This increase is interrupted by numerous fractures, which become more intensive with progressing stroke – an indication that the fragments are developing a flatter support surface. The force increase trend could be described globally with an exponent n = 1.
The evaluation of more than 600 diorite samples in the size fractions 25/40 mm to 450/560 mm from the Hohwald deposit allows the following conclusions as a global trend: Up to a relative stroke hr of 5 %, force development increases steeply to then only grow moderately up to a relative stroke hr of 20/25 % [12].
The relative stroke hr changes along the height of the crushing chamber of a gyratory crusher. At the crusher feed, it is much smaller than at the discharge. Typically, the stroke at the feed does not exceed 0.5 to 1.5 %, while it does not exceed 15 to 25 % at the discharge. In the upper part of the crushing chamber therefore, only the first part of the force-displacement curve takes effect. It is characterized especially by the crusher feed particles arranging themselves into place and reorienting themselves, so that here comminution of individual particles in an initially not completely full crushing chamber can be expected. In the lower part of the crushing chamber, the material to be crushed has already been pre-comminuted and pre-classified, and crushing chamber particles “go through” the entire force-displacement curve as a consequence of the larger stroke. The rear part of the force-displacement curve overlaps increasingly with compaction processes to, in the extreme case, locally occurring comminution processes in the material bed. With regard to the behaviour of the crusher feed, this stroke development along the crushing chamber means that the line load development p(ε) in the upper part can be characterized primarily by an exponent n > 1, while the exponent is n ≥ 1 in the lower part. This estimation is supported by the observation of the feed of pre-sized, that is scalped feed material. The weighting between the upper and lower crushing chamber in respect of load development moves in the direction of the upper crushing chamber. The load on the lower crushing chamber is reduced. This means that the exponent n increases for the entire crushing chamber, and accordingly the angle of the force application point falls, with the consequence of lower drive torque and lower consumed drive power.
With consideration of the force-displacement curves, constantly changing exponents n and therefore equally constantly changing force application angles δ can be expected. The fluctuations in the drive torque and the consumed motor power are caused not only by the feed rate, but also by the different fracture behaviour of the rocks in the crusher feed.
For the design of a gyratory crusher, a mean exponent n > 1 can be expected. For the force application angle δ, an angle between 30° and 40° should be chosen. At these angles, the size of the comminution zone εa to εe plays only a subordinate role so that the crusher feed has practically no influence on the force application angle δ. Only in extreme cases, with the feed of individual, hard lumps of rock at one side of the crusher, the angle can almost halve. The resulting comminution force Fres will, however, be lower in this case.
An evaluation of the literature only provides limited information. Olevskii [8] derives an angle δ of 5°45‘. However, the result is based on load assumptions in the Sectors I, II and III. Mölling [5], on the other hand, bases the specified δ = 20° on load development in Sector II over an angle range of 40°, without, however, providing further details on the calculation or a measurement. This angle δ = 20° has also been adopted in a book [3] on comminution and classifying machines.
To summarize, for the design of gyratory crushers, a force application angle δ of around 30° to 40° can be assumed providing the crushed product exhibits brittle material behaviour. In the comminution of limited crusher feed in the crushing chamber, the force application angle δ can be almost halved. For the calculation of the drive torque and power, these values are only relevant in exceptional cases of individual high-strength lumps of rock in the crushing chamber. A validation of the derived force application angles δ can be enabled based on measurements in gyratory crushers.
Literatur • Literature
[1] Chen, Z.; Wang, G.; Xue, D. & Bi,Q. (2020): Simulation and optimization of gyratory crusher performance based on the discrete element method. Powder Technology 376, S. 93-103
[2] Evertsson, C. (2000): Cone Crusher Performance. Dissertation, Chalmers University of Technology, Gothenburg/Sweden
[3] Höffl, K. (2011): Zerkleinerung- und Klassiermaschinen. Springer-Verlag, Berlin, Heidelberg, 431 Seiten
[4] Mölling, H. (1960): Grundlagen der Grobzerkleinerung. Aufbereitungs-Technik Nr. 7, S. 287-298
[5] Mölling, H. (1967): Berechnungsansätze für Grobzerkleinerungsmaschinen. Aufbereitungs-Technik Nr. 2, S.63-79
[6] Moncada, M.; Toledo, P.; Betancourt, F. & Rodriguez, C. (2021): Torque Analysis of a Gyratory Crusher with the Discrete Element Method. Minerals 2021, 11, 878. https://doi.org/10.3390/min11080878, S. 1-28
[7] Mu, W. (2022): Berechnung der Antriebsleistung von Kreiselbrechern. Master Thesis, Technische Universität Bergakademie Freiberg, Freiberg/Deutschland
[8] Olevskij, V. (1958): Konstrukcii rasceti i ekspluatacija drobilok. Gosudarstvennoje Naucnoje-Techniceskoje Izd., Moskva, 460 Seiten
[9] Rumpf, H. (1965): Die Einzelkornzerkleinerung als Grundlage einer technischen Zerkleinerungswissenschaft. Chemie-Ingenieur-Technik, Nr. 3, S. 187-202
[10] Schönert, K. (1966): Einzelkorn-Druckzerkleinerung und Zerkleinerungskinetik. Dissertation, Technische Hochschule Karlsruhe, Karlsruhe/Deutschland
[11] Silbermann, F. (2004): Beitrag zur Modellierung der Arbeitsweise von Kegelbrechern in Bezug auf den Materialstrom. Dissertation, Technische Universität Bergakademie Freiberg, Freiberg/Deutschland
[12] Szczelina, P. (2000): Auslegung von Backenbrechern durch Modellierung des Körnerverhaltens. Dissertation, Technische Universität Bergakademie Freiberg, Freiberg/Deutschland
[13] Westerfeld, S. (1985): Gyratory Crushers. In: Weiss, N. (Hrsg): SME Mineral Processing Handbook. Kingsport Press, Kingsport, TN/USA, S. 3B-28 to 3B-49
Author:
Prof. Dr.-Ing. Georg Unland
Technische Universität Bergakademie Freiberg